LitMotion Debugger
By using the LitMotion Debugger window, you can view information about the motions you've created.
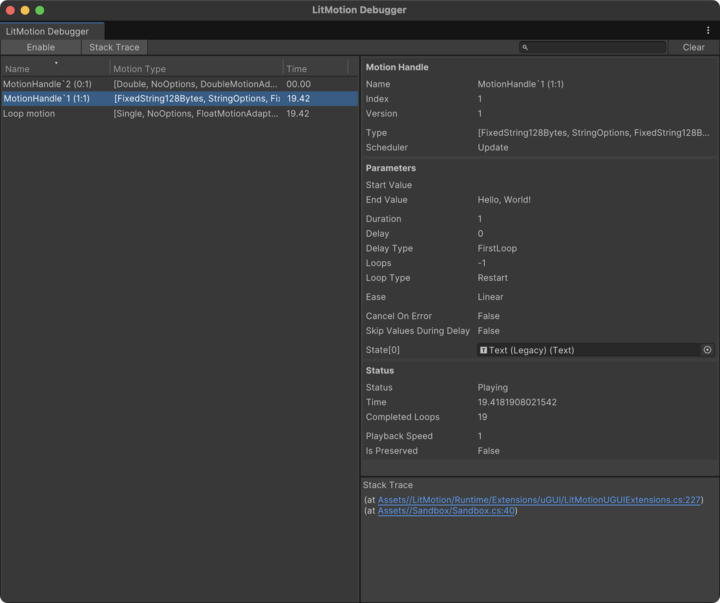
Open the window from Window > LitMotion Debugger, and click [Enable] to activate the debugger. You can also click [Stack Trace] to enable and view the stack trace when the motion is created.
Warning
Enabling the debugger can significantly impact performance. It is recommended to keep it disabled and only enable it during debugging sessions.
Debug Name
In the debugger, you can search for a specific motion by its name. The default debug name follows this format:
$"MotionHandle`{StorageId}({Index}:{Version})"
This debug name can be changed by passing a custom name using WithDebugName() when creating the motion.
var handle = LMotion.Create(0f, 1f, 1f)
    .WithDebugName("name")
    .Bind(x => { });
You can also get the debug name using GetDebugName().
var name = handle.GetDebugName();
This debug name is only preserved in Debug builds and will be removed in Release builds. To use this feature in a Release build, add LITMOTION_DEBUG to the Scripting Define Symbols.